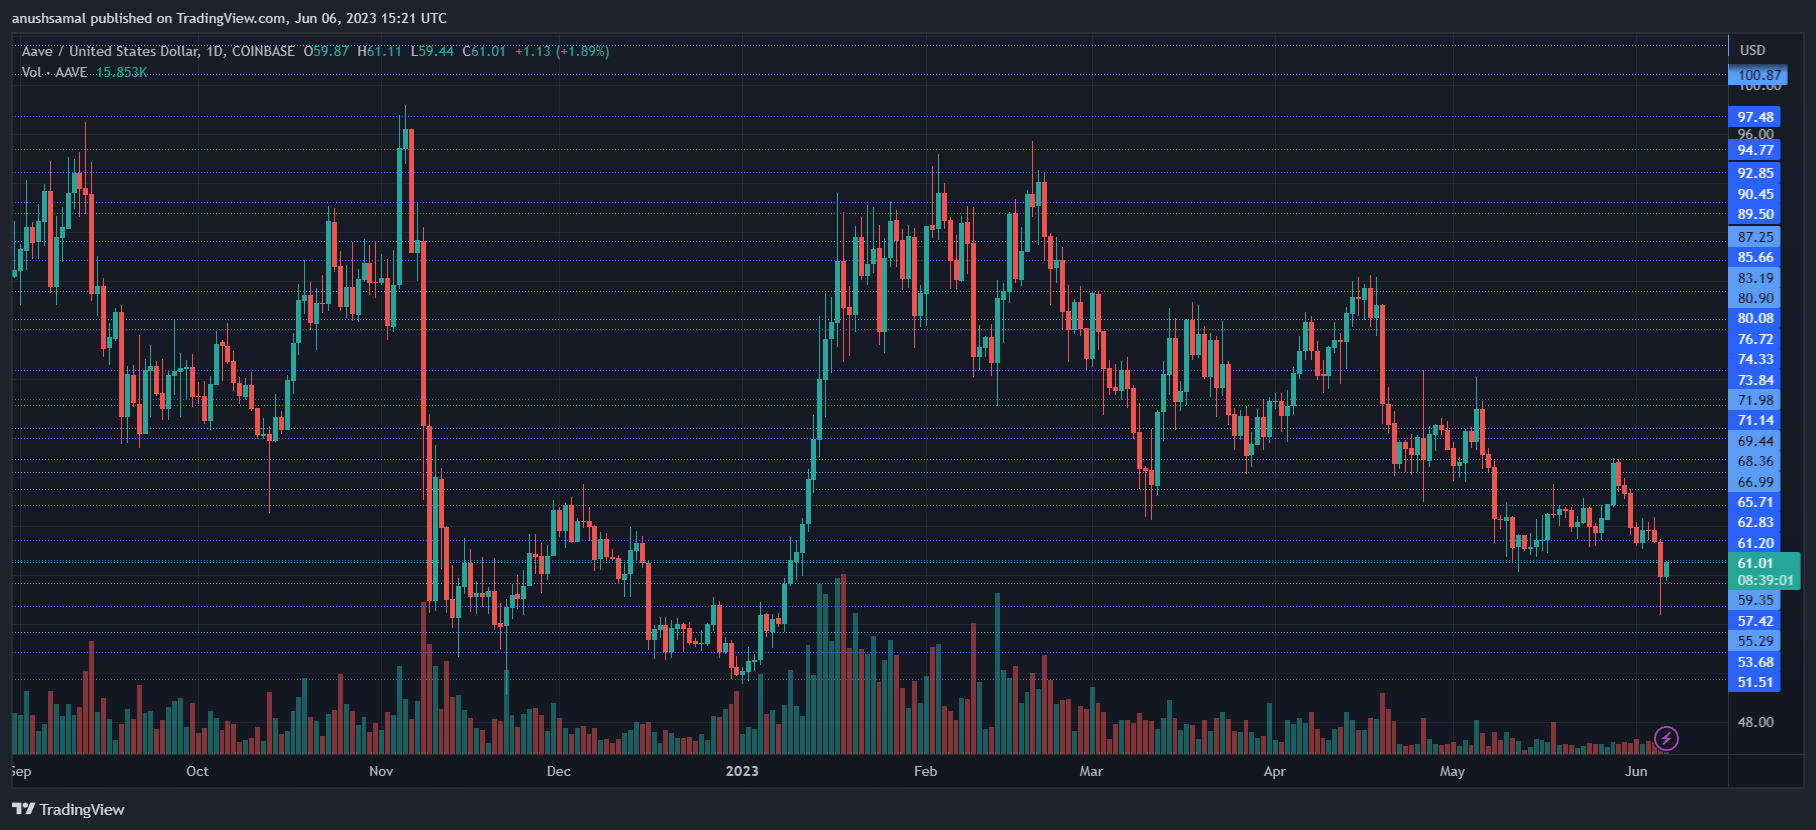
After experiencing a promising start to the year, AAVE faced a setback when it encountered resistance at the $92 level, resulting in a 34% correction over a two-month period. The recent blow to the crypto market caused by the SEC suing Binance has further impacted the altcoin’s performance.
In the past 24 hours, AAVE has lost 3% of its value, and on the weekly chart, the coin has seen a significant plunge of nearly 12%. Technical indicators suggest the presence of considerable bearish pressure, with both demand and accumulation declining.
With Bitcoin also experiencing a drop to the $25,000 zone, most altcoins have exhibited similar price actions. AAVE has struggled to maintain its price above a crucial support level, and as selling pressure has intensified, it has dipped below that level. The market capitalization of AAVE has also depreciated, indicating that sellers currently hold control over the price at this time.
Aave Price Analysis: One-Day Chart

As of the time of writing, Aave is trading at $61. The bulls encountered resistance at the $62 level as the broader market showed signs of weakness in recent days. The altcoin’s resistance levels are at $61.30 and $62.80.
If the price breaks above $62.80, it could potentially reach the $65 price level. However, the bears have exerted influence, which may cause Aave to approach its support line at $59.
If unable to stay above this support, the coin could drop to $57 and potentially even $51, serving as short-selling targets for traders. The trading volume for Aave in the last session has remained low, indicating a lack of strong buying pressure.
Technical Analysis

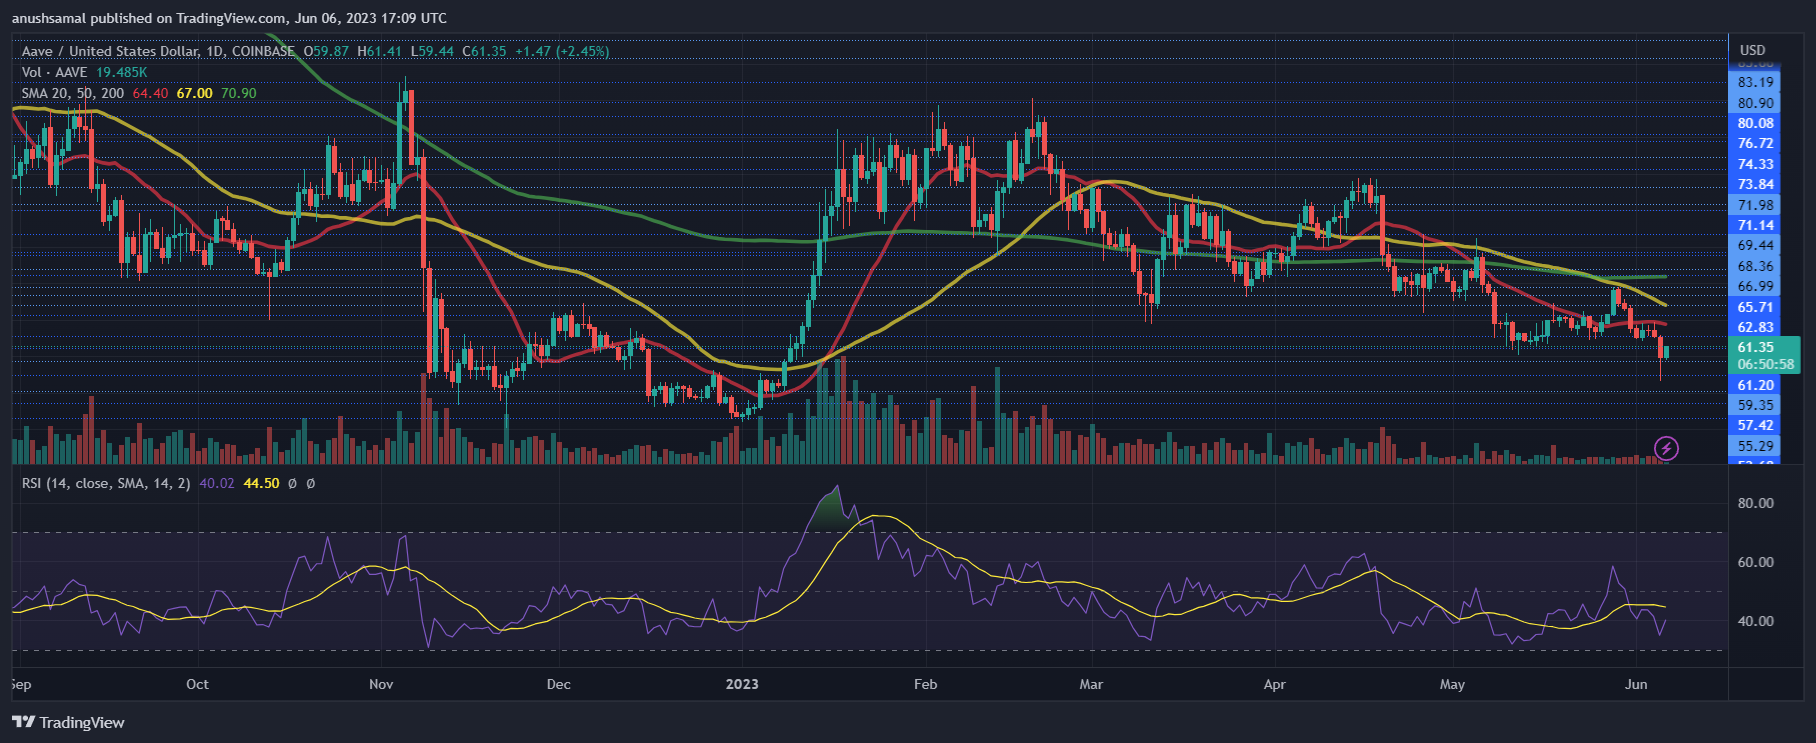
Aave has been facing challenges in generating demand, as reflected in its chart. The Relative Strength Index (RSI) indicates that sellers have outnumbered buyers in the market, with the RSI remaining below the half-line.
In order for buying strength to persist, the price needs to surpass overhead resistance levels. Additionally, Aave has dropped below the 20-Simple Moving Average line, suggesting that sellers have been driving the price momentum in the market. These factors indicate the prevailing bearish sentiment surrounding Aave’s performance.

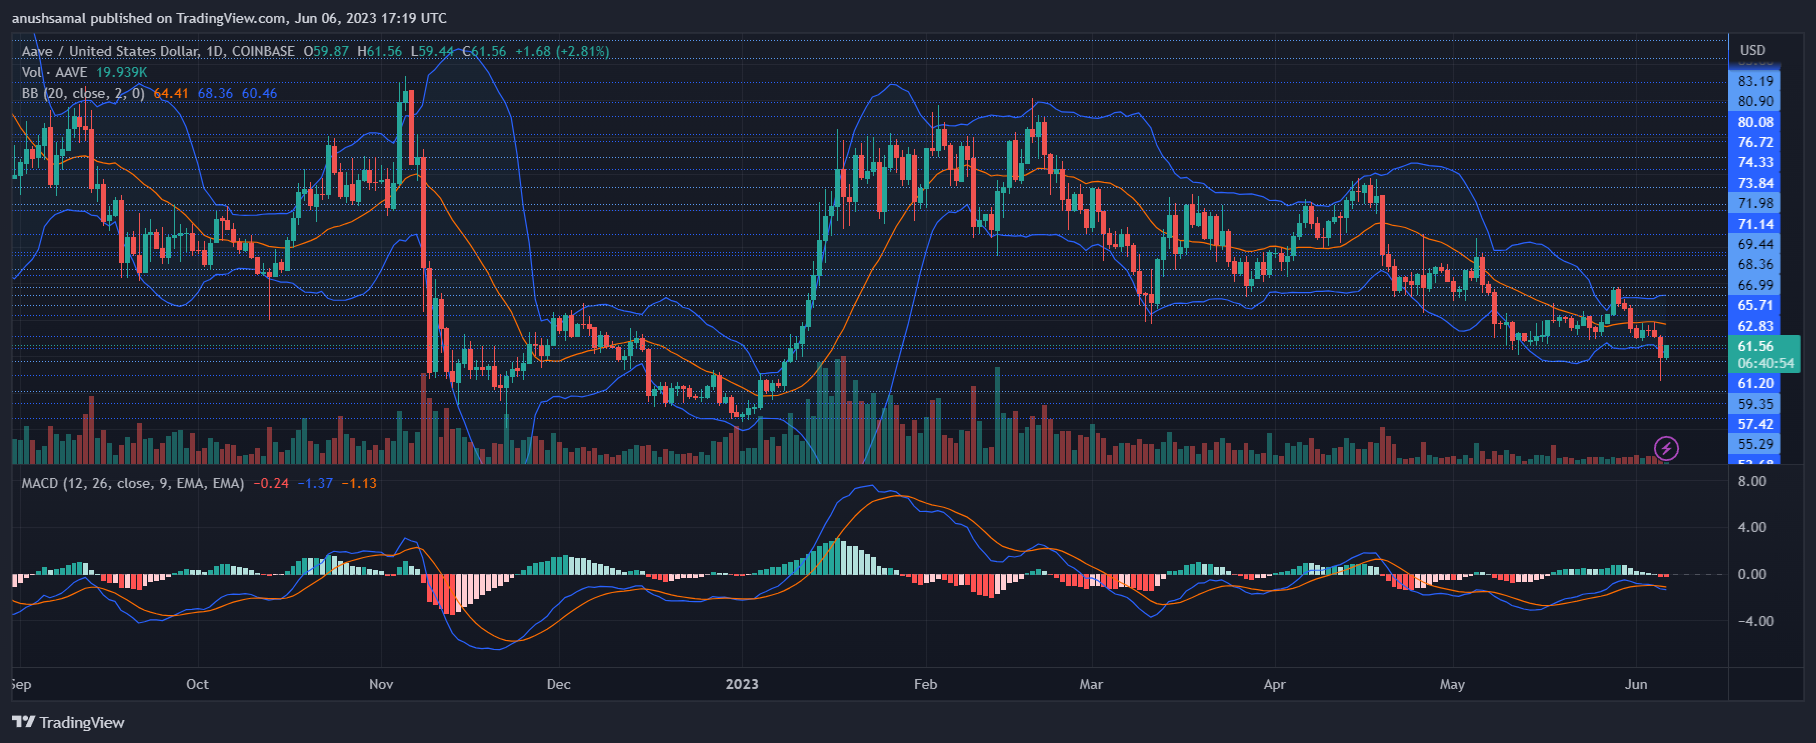
Confirming the bearish sentiment on the chart, Aave has generated sell signals on the one-day chart, aligning with other indicators. The Moving Average Convergence Divergence (MACD), which illustrates price momentum and potential reversals, has formed red histograms, indicating sell signals for the altcoin.
The Bollinger Bands, which measure price volatility and fluctuations, have mostly remained parallel with slight divergence. This suggests that the price of the altcoin may experience slight fluctuations in the upcoming trading sessions.
Featured Image From Figma, Charts From TradingView.com


