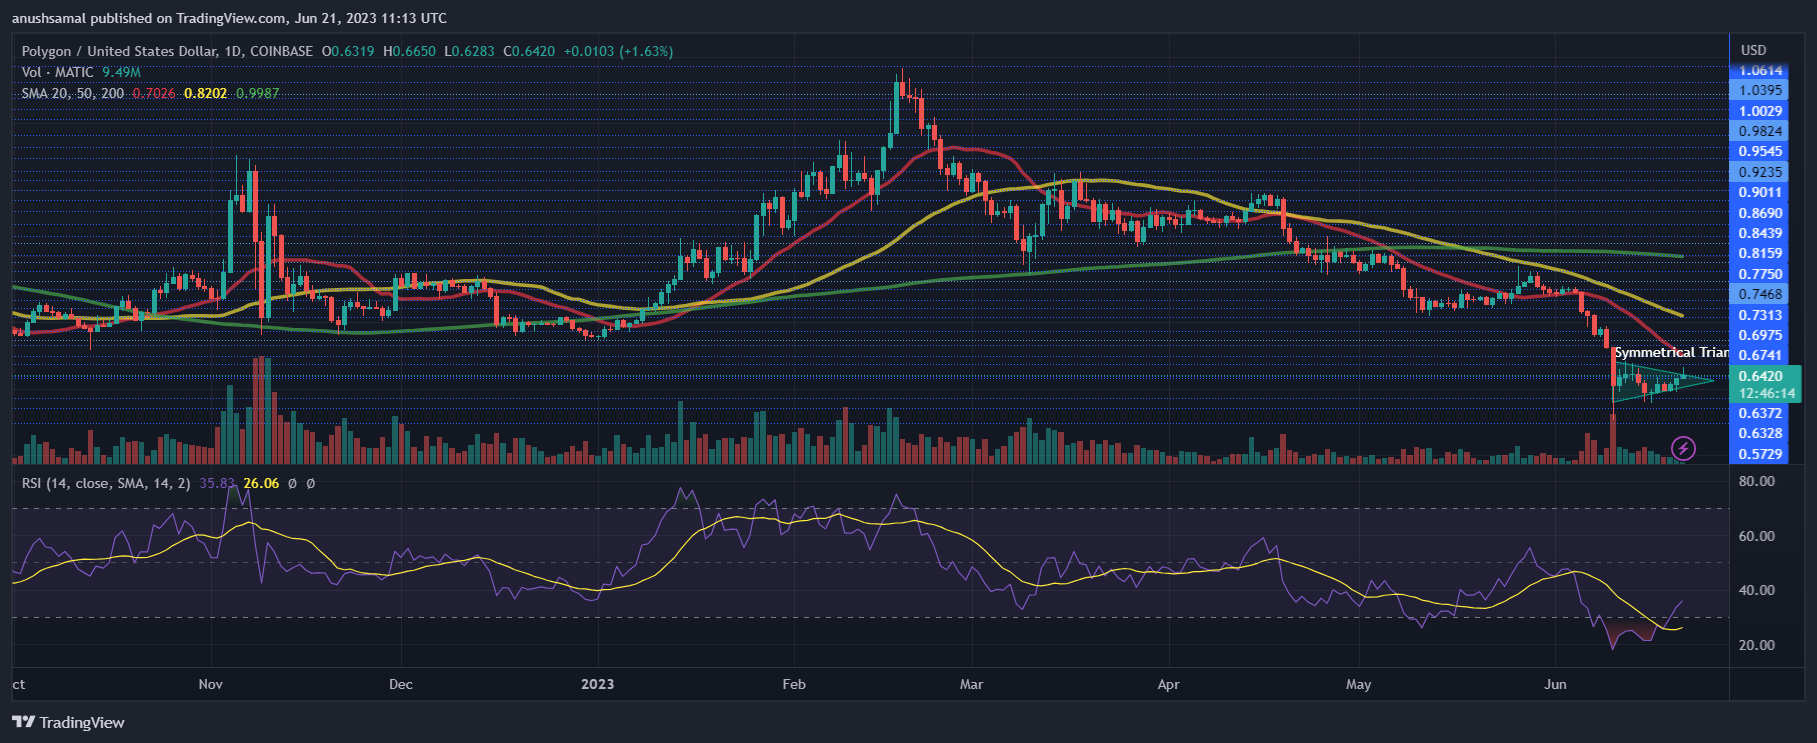
At the time of writing, MATIC was trading at $0.64. Following its drop below the $0.90 price level, the altcoin has been experiencing a downtrend, but there have been attempts by the bulls to reverse this trend.
The key resistance level for MATIC is currently set at $0.70, and if the price manages to surpass this level, it would provide an opportunity for the bulls to gain control.
However, if the price fails to breach the $0.70 resistance, it could weaken the momentum and potentially cause MATIC to fall below its immediate support line.
The nearest support levels are located at $0.60 and then at $0.57. It is worth noting that MATIC has formed a symmetrical pattern, and recently broke out from it, indicating a potential incoming bullish trend.
Technical Analysis

Despite a slight increase in demand, MATIC is still under the influence of bearish market sentiment. This is evident in the Relative Strength Index (RSI) which is below the 50-mark and only slightly above the 30-mark. These RSI levels indicate a strong selling influence in the market.
Furthermore, the altcoin has dropped below the 20-Simple Moving Average (SMA) line, which suggests that demand for the altcoin is still low. This decline below the SMA line also indicates that sellers are currently driving the price momentum in the market.

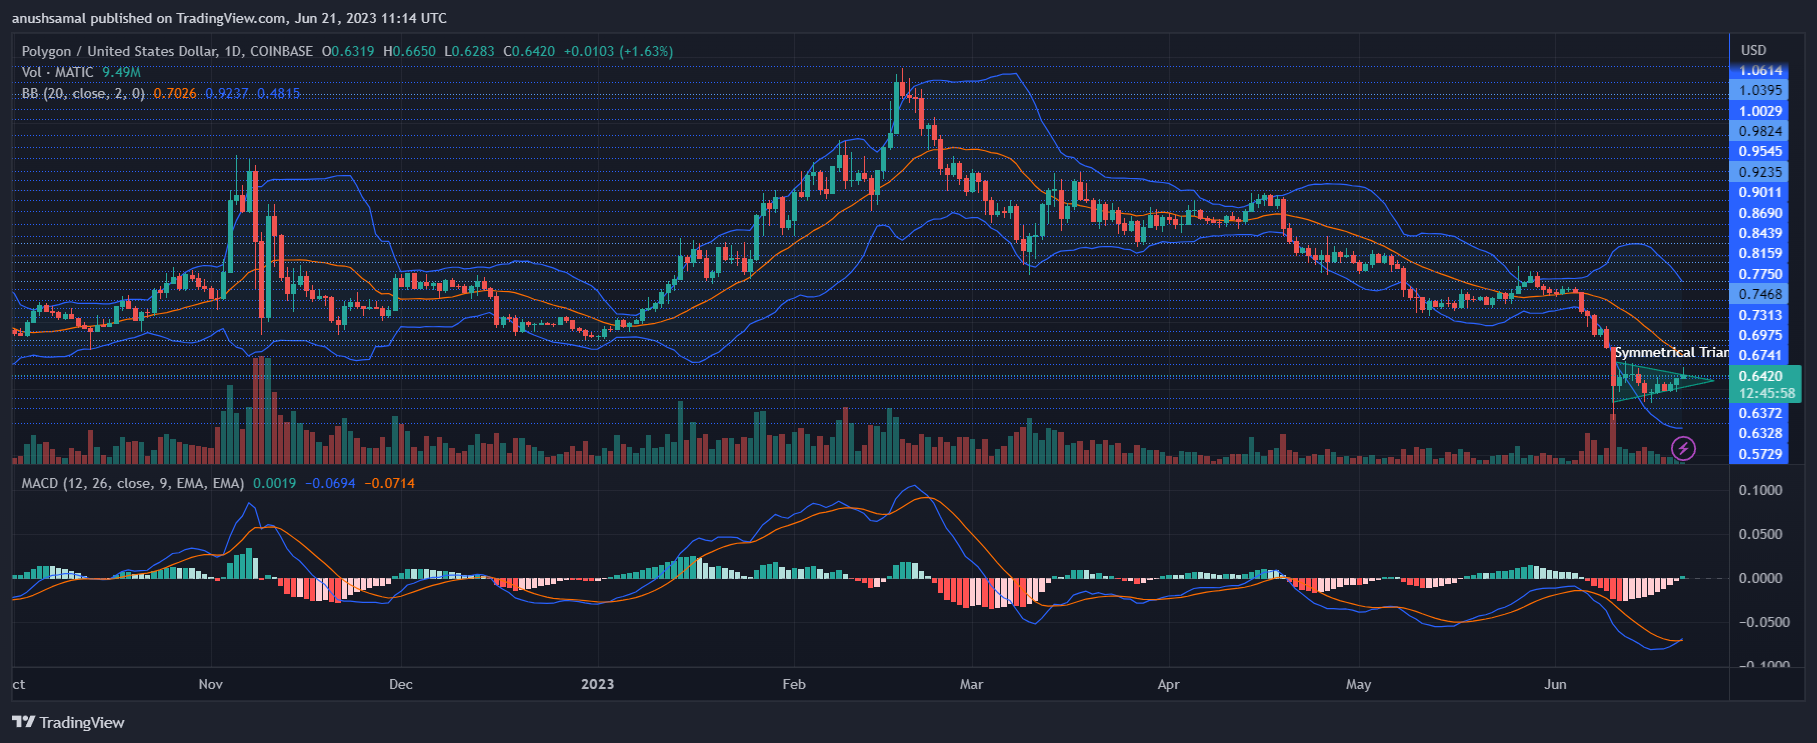
On the daily chart, the altcoin has shown mixed signals, including some buy signals. The Moving Average Convergence Divergence (MACD) indicator indicates momentum and potential shifts. It has recently formed one green signal, which is tied to a buy signal for the altcoin.
This suggests a possibility of bullishness in the near term. However, for the bullish scenario to strengthen, the altcoin needs to reclaim the $0.70 level. This price level is important for the altcoin to gain upward momentum.
Meanwhile, the Bollinger Bands, which measure volatility and price fluctuation, are currently wide apart. This indicates an expectation of increased price volatility in the market.
The upper band of the Bollinger Bands coincides with the $0.74 resistance level, highlighting its significance as an important resistance level to watch for.
Featured Image From UnSplash, Charts From TradingView.com


