Dogecoin (DOGE) is once again at the center of excitement in the crypto space. Over the days, the meme-inspired cryptocurrency experienced a remarkable surge, gaining 25% in just two weeks. As traders and investors closely watch DOGE’s price movements, a combination of technical indicators and on-chain data offer intriguing insights into what may lie ahead for DOGE.
Dogecoin Price Analysis
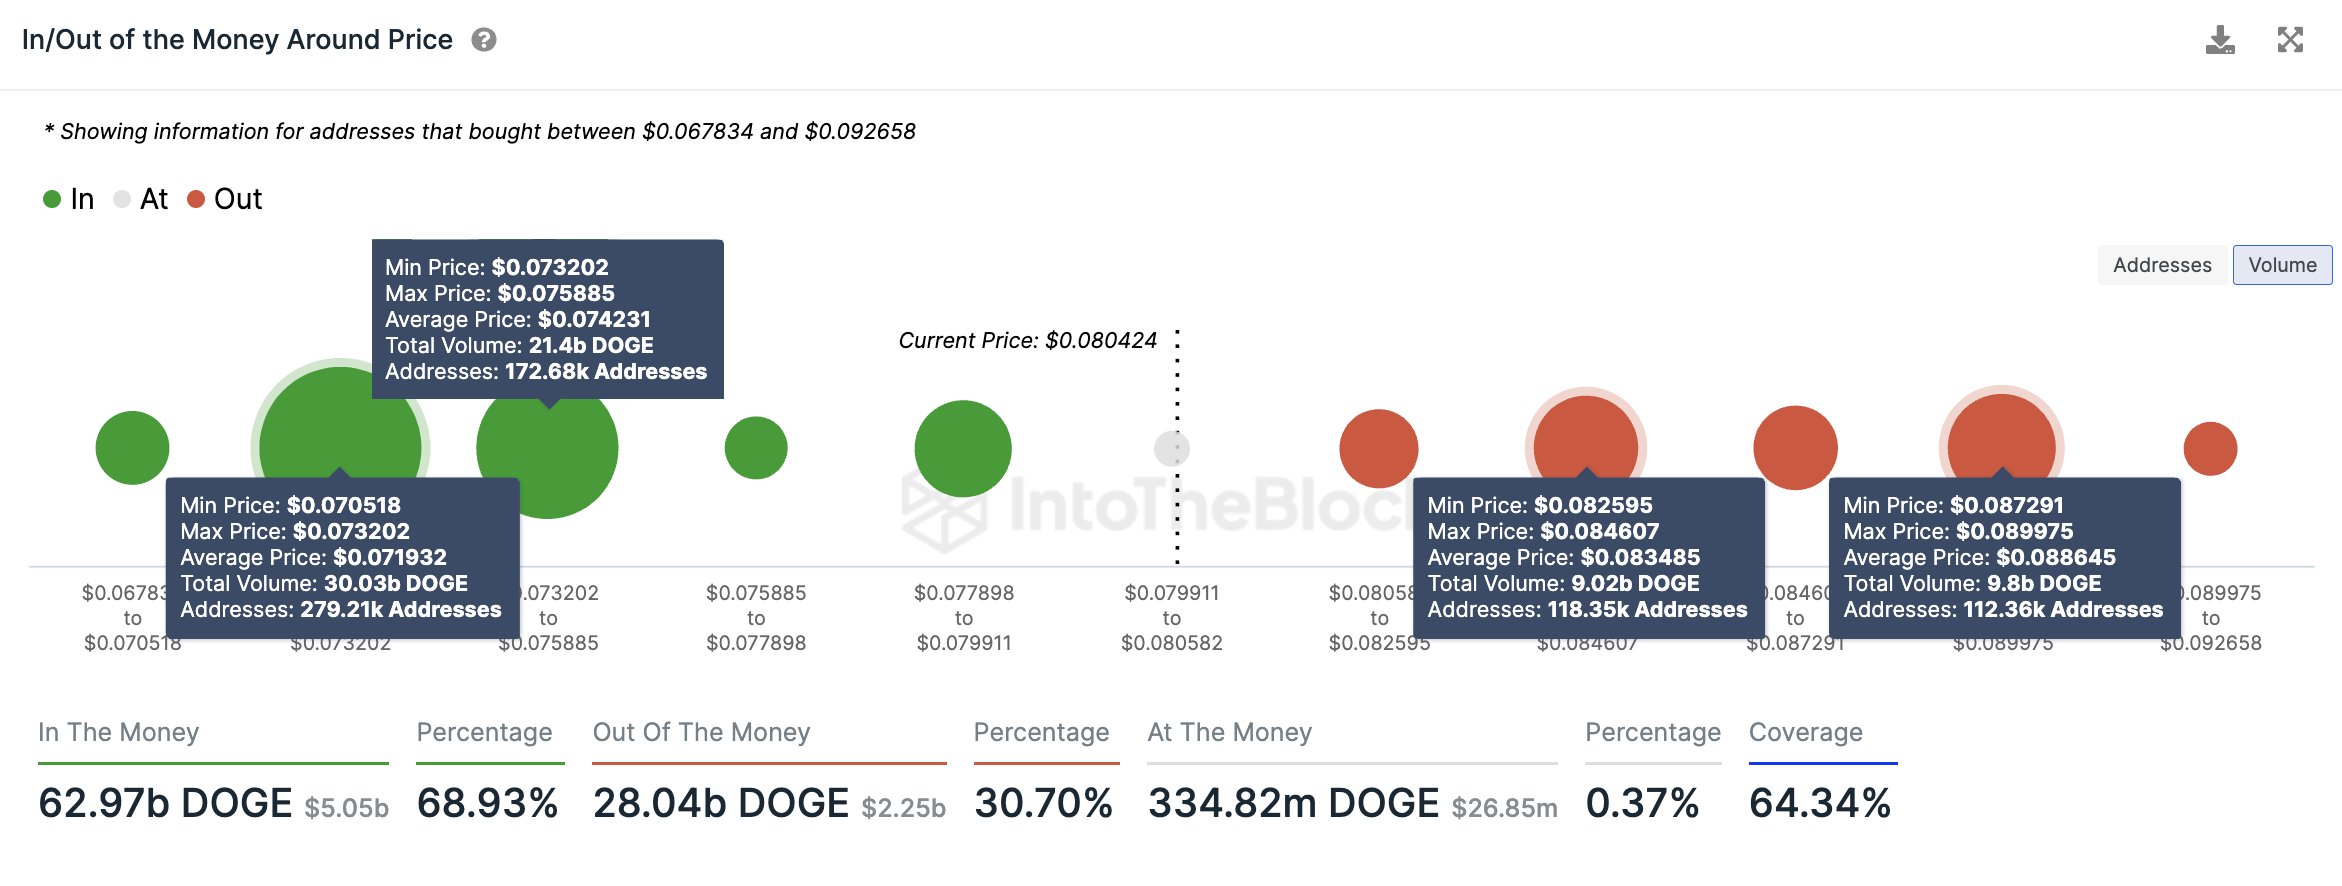
According to renowned analyst Ali Martinez, DOGE’s price action has established a crucial support zone between $0.070 and $0.076. Martinez points out that in this price range, a staggering 452,000 wallets acquired a significant amount of DOGE, totaling 51.4 billion coins. On the other hand, the cryptocurrency faces stiff resistance at $0.083 and $0.088, signaling potential hurdles for further upward momentum.

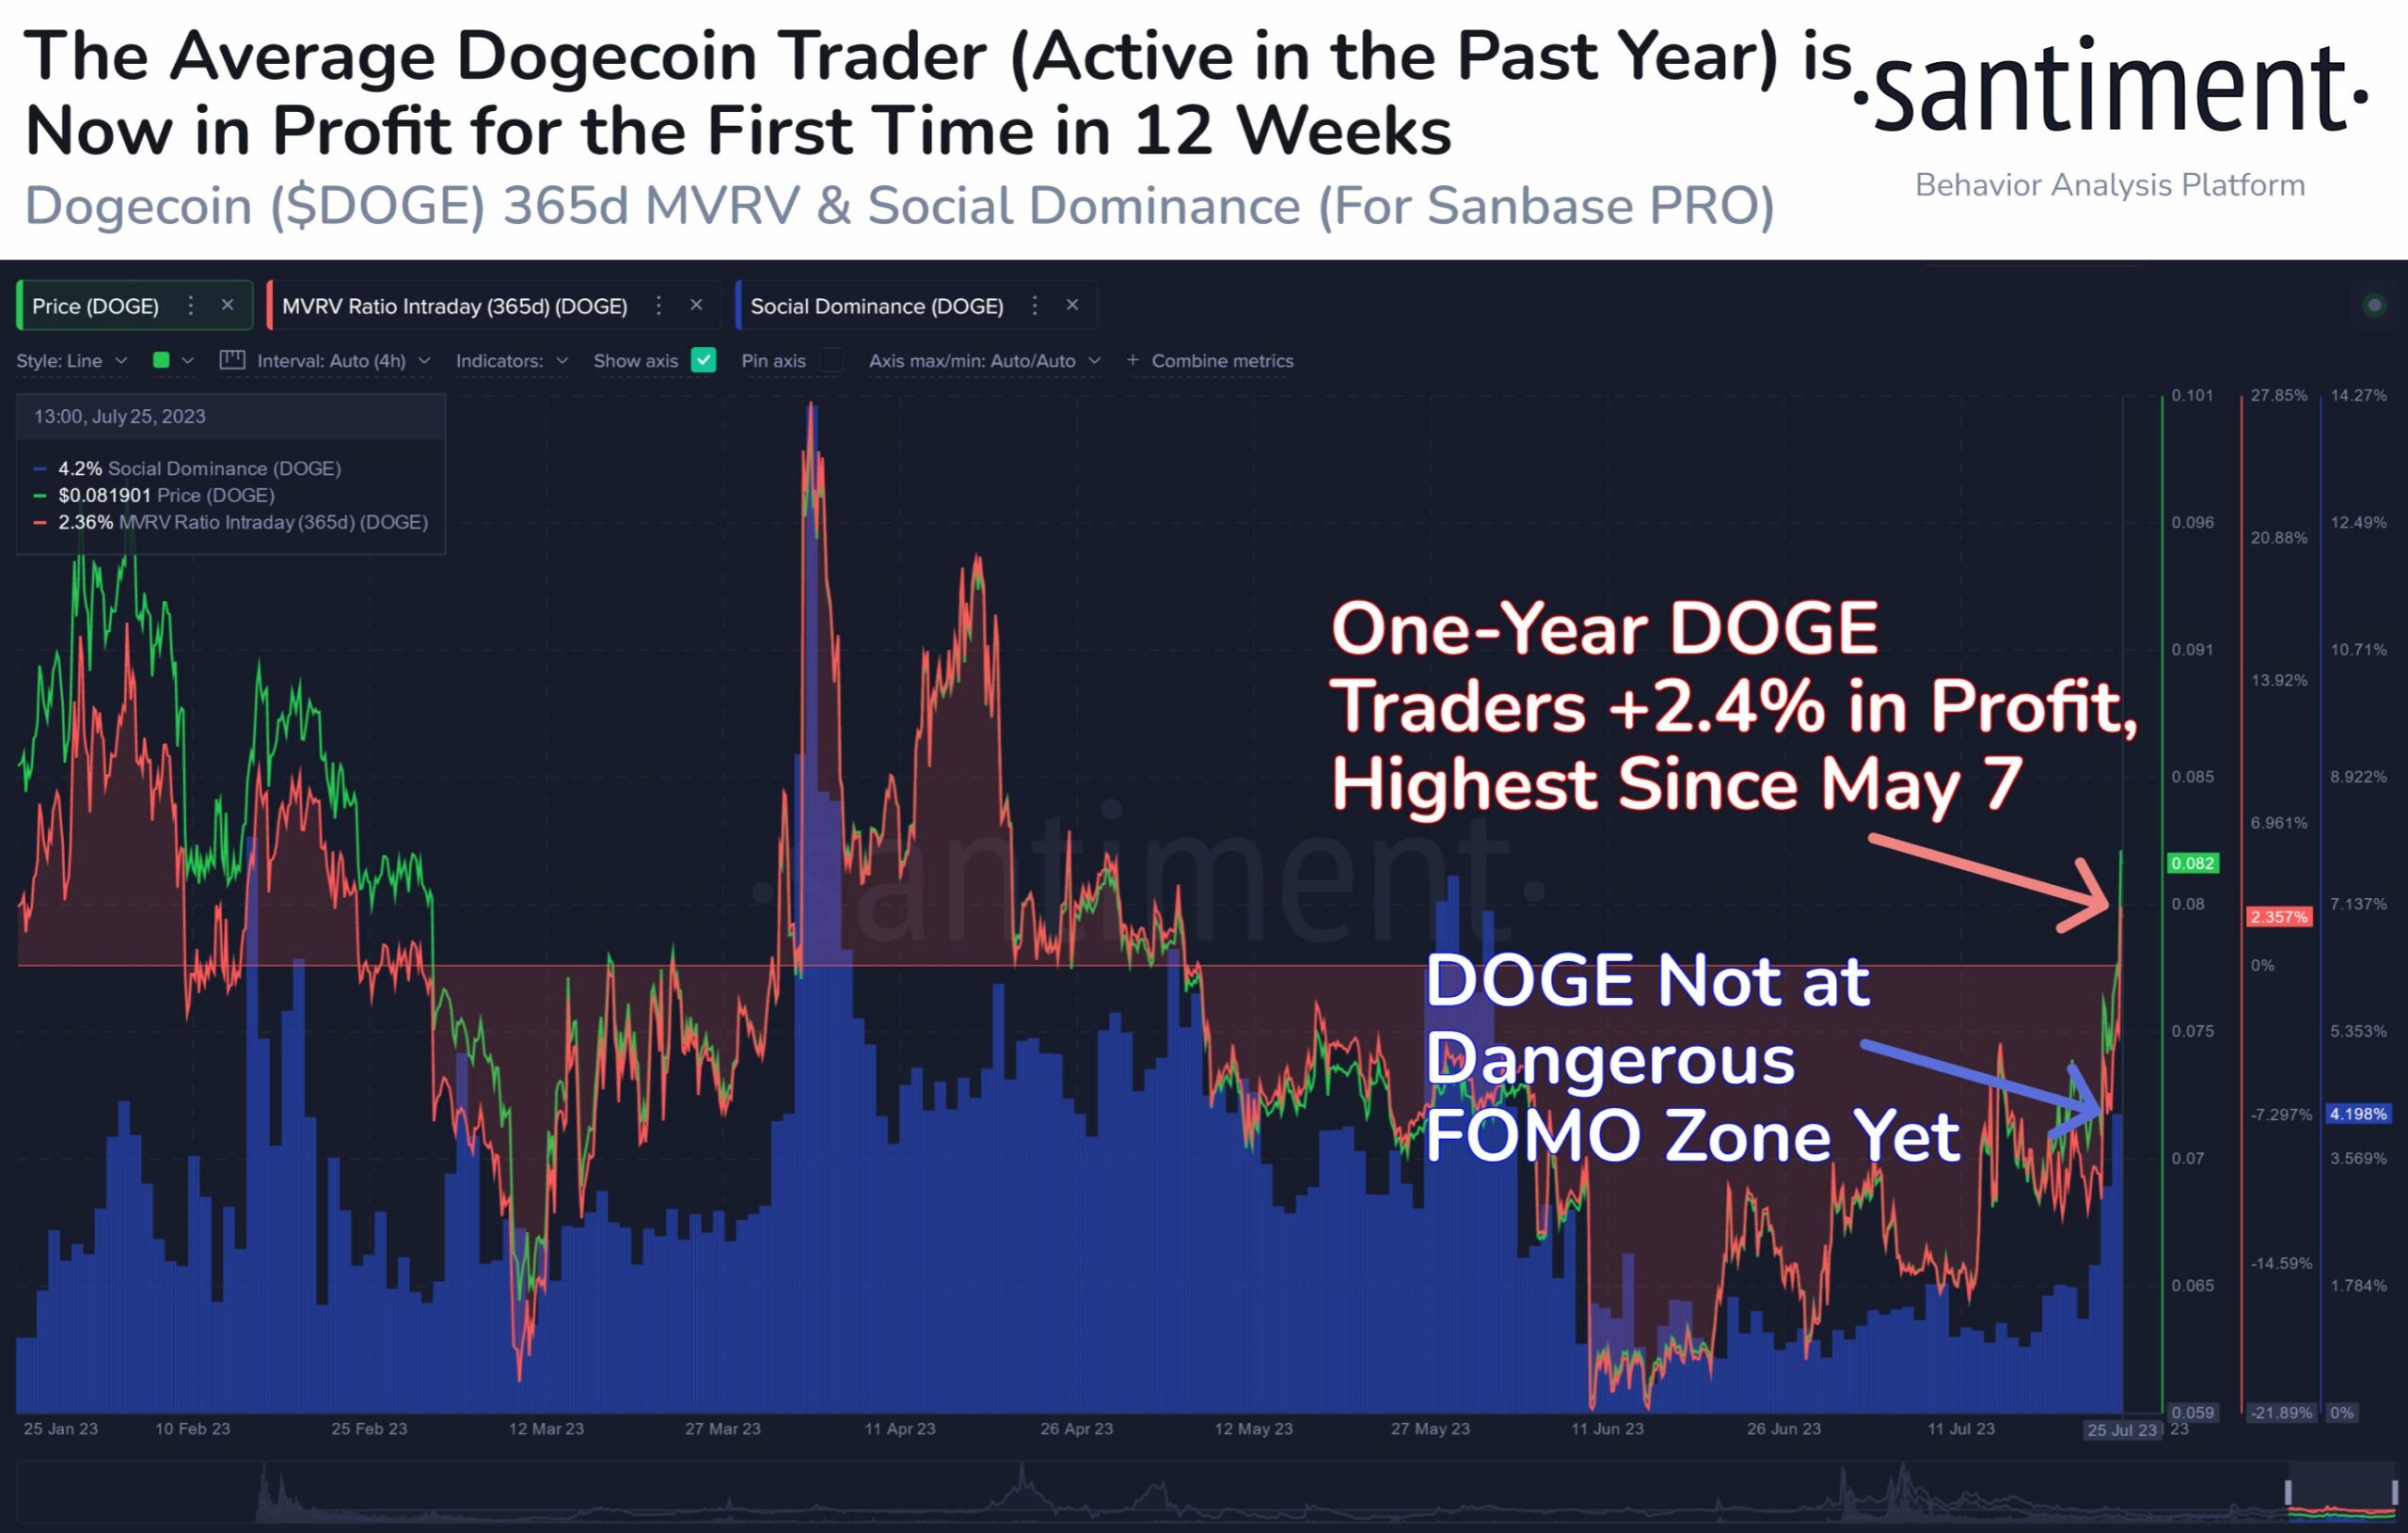
On-chain data firm Santiment adds to the optimism surrounding DOGE, highlighting that the average DOGE trader, active in the past year, is now in profit for the first time in 12 weeks, showing a 2.4% gain. This development is considered a significant milestone and could attract more interest from traders.
On the other hand, more traders in profit means that profit-taking is more likely, thus selling pressure could build up. Moreover, the DOGE social dominance indicator has not yet reached the dangerous “FOMO zone,” indicating the possibility of a further upward surge.

Undoubtedly, the current price momentum of Dogecoin is due to Elon Musk. The recent price rally can be attributed to speculation that the meme coin may become a payment method on Twitter’s rebranded platform, “X.” Traders seem eager to front-run Elon Musk’s decision on this matter, as he has been a vocal supporter of Dogecoin.
This has fueled roaring speculation, resulting in a surge in the perpetual futures market tied to DOGE, with notional open interest exceeding $512 million for the first time since April 19. On that day, DOGE traded at $0.0941 and saw a price drop of about 19% over the next three days.

While the influx of new money into the market is generally seen as a confirmation of an uptrend, traders should remain cautious. As profit-taking becomes more likely with more traders in profit, selling pressure could build up, potentially leading to a temporary pullback in DOGE’s price. However, at press time, the open interest weighted-funding rates were close to zero, suggesting a balance between long and short positions.
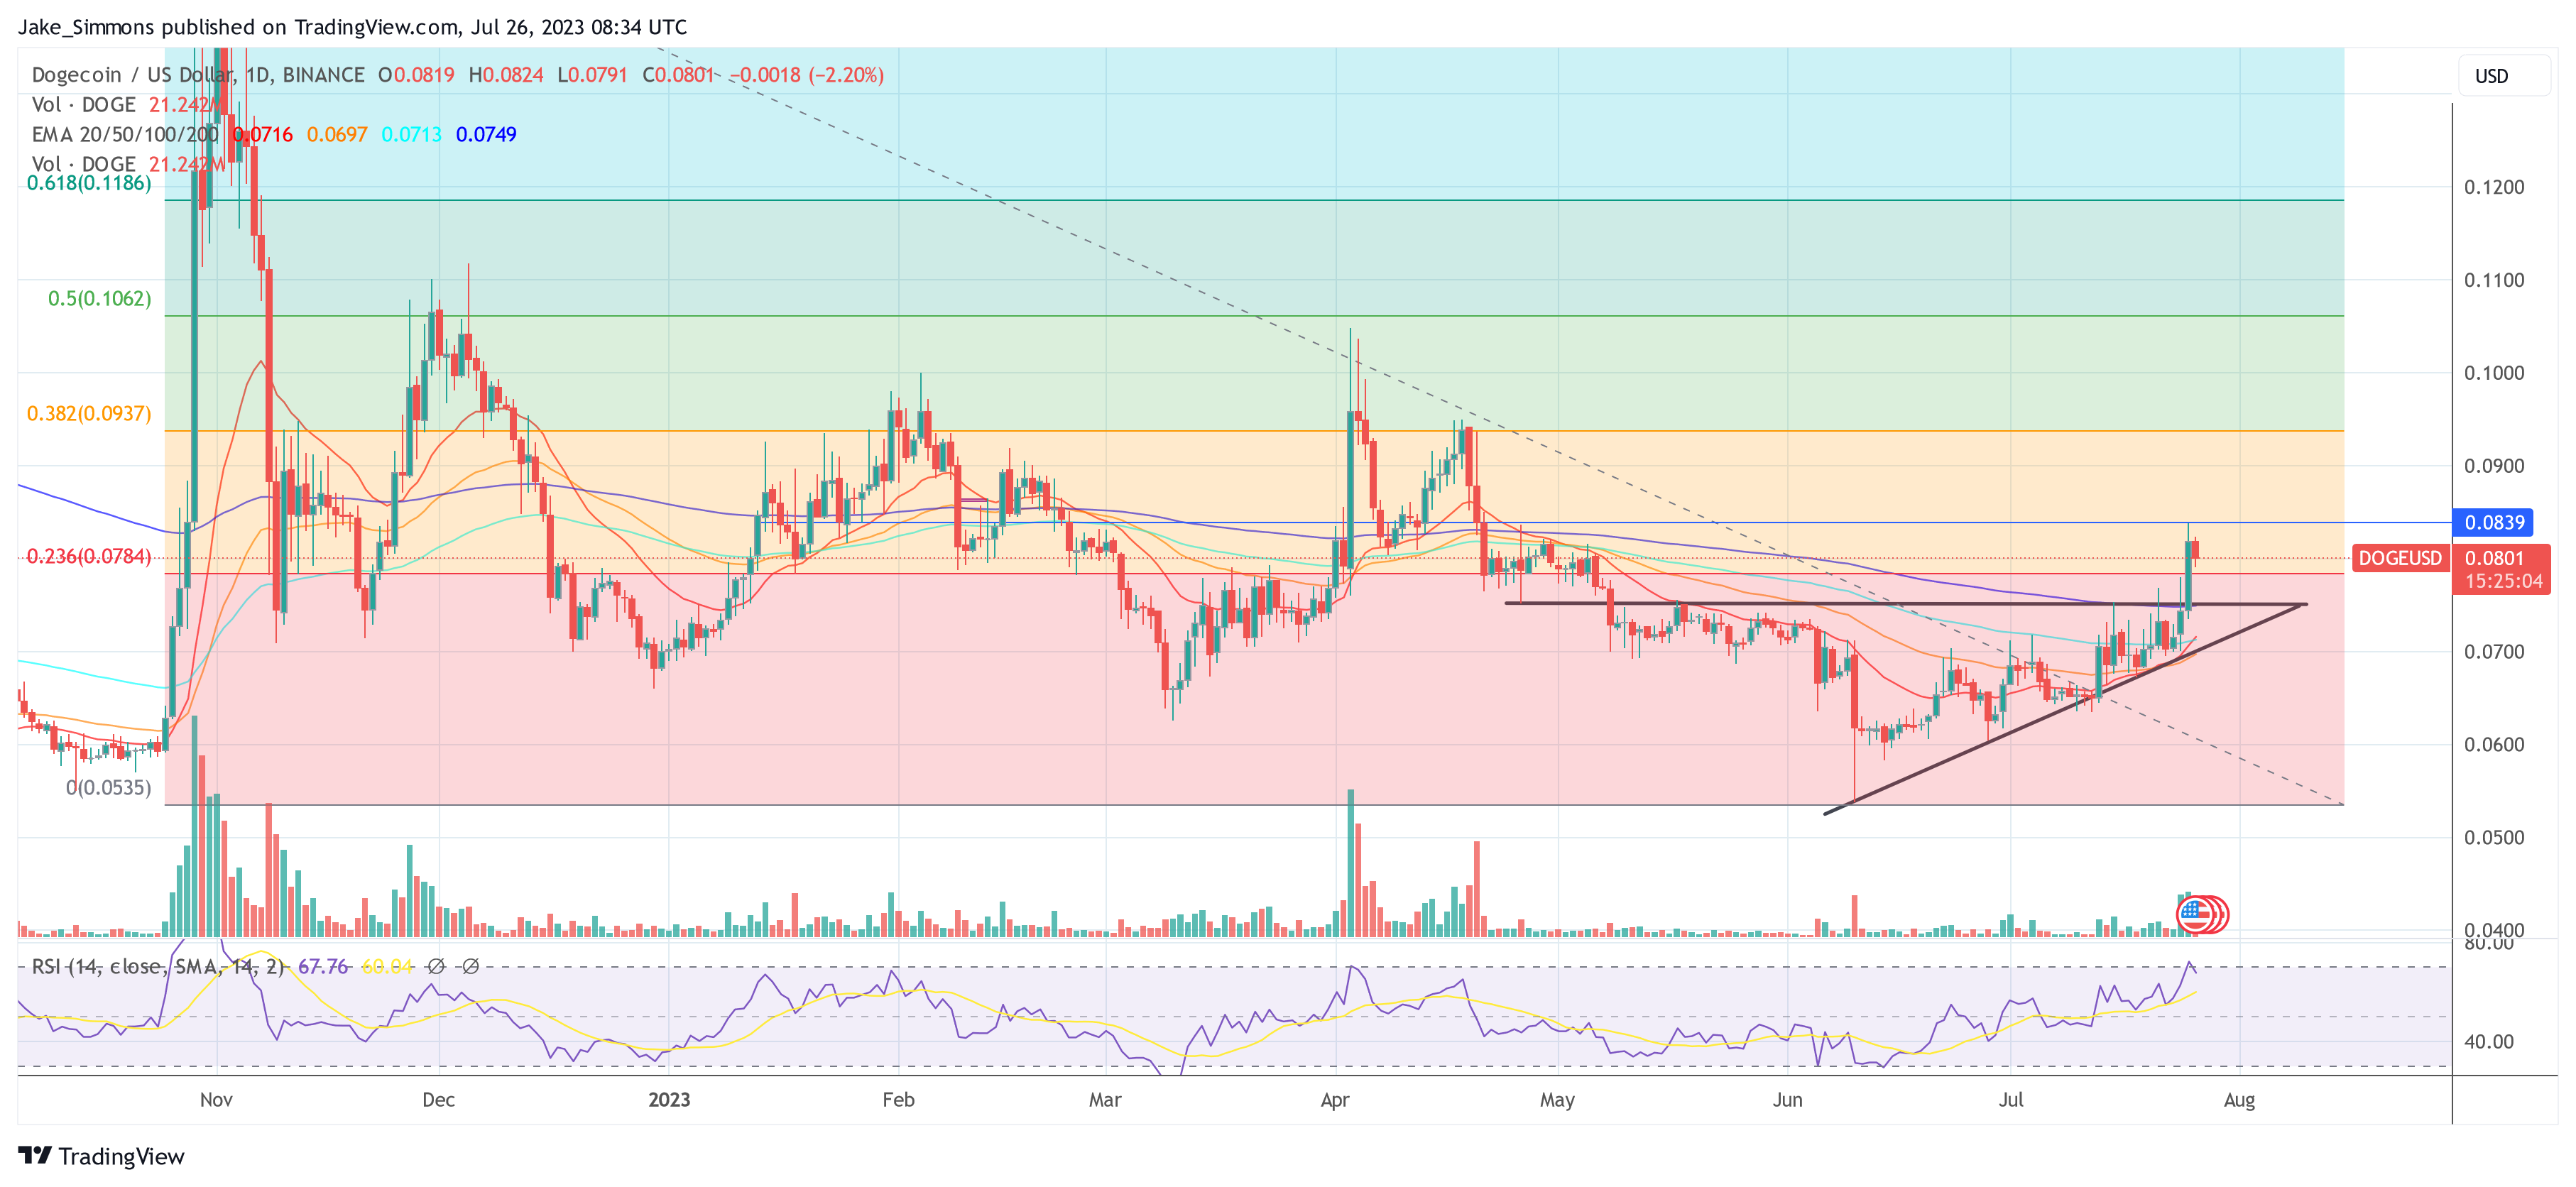
DOGE/USD 1-Day Chart
As explained in the last chart analysis before the pump, DOGE had formed an ascending triangle formation signaling a trend reversal. As predicted, DOGE broke out above the resistance at $0.075 and initially stalled at the 23.6% Fibonacci retracement level ($0.0785). However, after a brief pause, the Dogecoin price continued its rally and climbed to $0.0839, where the bulls paused for the time being due to resistance.
While the daily RSI is still not overbought at 68.5, another push higher seems possible. However, lower profit-taking seems to dominate the market for now, so a retest of the 23.6% Fibonacci retracement at $0.0785 could be a likely scenario. If the bulls defend this support, DOGE could rise another 20% to the 38.2% Fibonacci retracement at $0.0937. The next target would then be the yearly high at $0.1044 and the 50% Fibonacci retracement level at $0.1066.

Featured image from iStock, chart from TradingView.com


